你让 AI 扮演的那 1000 个「用户」,最擅长的不是回答问卷,是刻板印象。
「合成用户」这门生意卖得很顺:给模型一段人设——年龄、性别、学历、城市、政治立场——让它替真人填问卷,几分钟出结果,几块钱 API 费,调研周期从几个月缩到一个下午。产品团队拿它排需求优先级,市场团队拿它预测哪个人群最买账。
问题在于,大家验收它的方式几乎只有一种:把整体答案分布画出来,看像不像真人。像,就信了。可你真正拿它做的决定,从来不是「全体用户平均怎么想」,而是**「哪一群人最在意」**。恰恰在这一层,它是错的,而且错得很有方向。
平均数很像,这正是陷阱
Chen、Zhu、Zheng《When Synthetic Users Fail》(arXiv:2607.26348) 用两套真实问卷做对照:美国综合社会调查 GSS(2016–2024,10 道态度题,约 1.47 万名受访者)和世界价值观调查 WVS 第 7 轮(63 个国家,16 道价值观题,约 9.2 万名受访者)。被测的是 Claude Haiku 4.5、Claude Sonnet 4.6、Llama 3.1 8B 和 Llama 3.3 70B,同一套提示词、同一套评分。
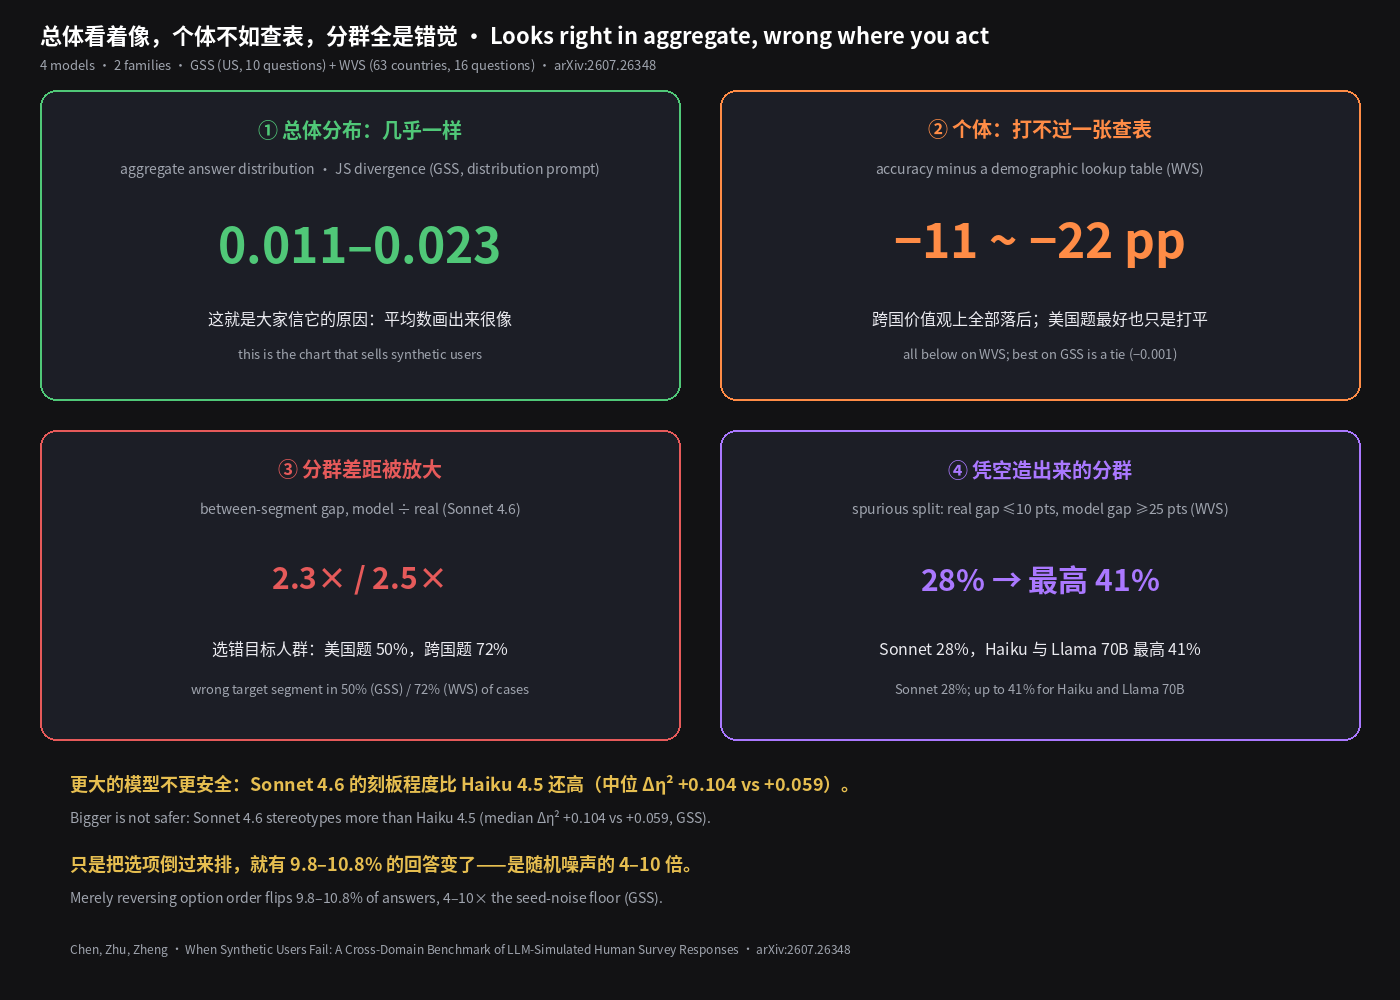
先说它做对的部分:让模型直接给出答案的概率分布时,GSS 上和真人分布的 JS 距离只有 0.011–0.023,几乎重合。这张图,就是合成用户最好卖的那张图。
但这篇论文多做了一件大多数研究没做的事:拿一张最笨的查表来当对照组——同样的人口学信息,直接查「真实数据里这类人最常选什么」。结果:
- 个体层面打不过查表。 GSS 上最好的模型也只是和查表打平(−0.001,置信区间跨零),Llama 8B 落后 9 个点;WVS 上每个模型都比查表低 11–22 个百分点。换成按距离给部分分、或者直接比概率打分,结论都不变。
- 一句话:让模型扮演一个具体的人,它给不出比「这类人通常怎么答」更多的信息;遇到价值观题,还更差。
它不是把人抹平,是把身份当成命运
很多人担心 AI 会把少数群体「抹平」。这篇论文测出来的方向正好相反:模型系统性地夸大身份对观点的决定程度。
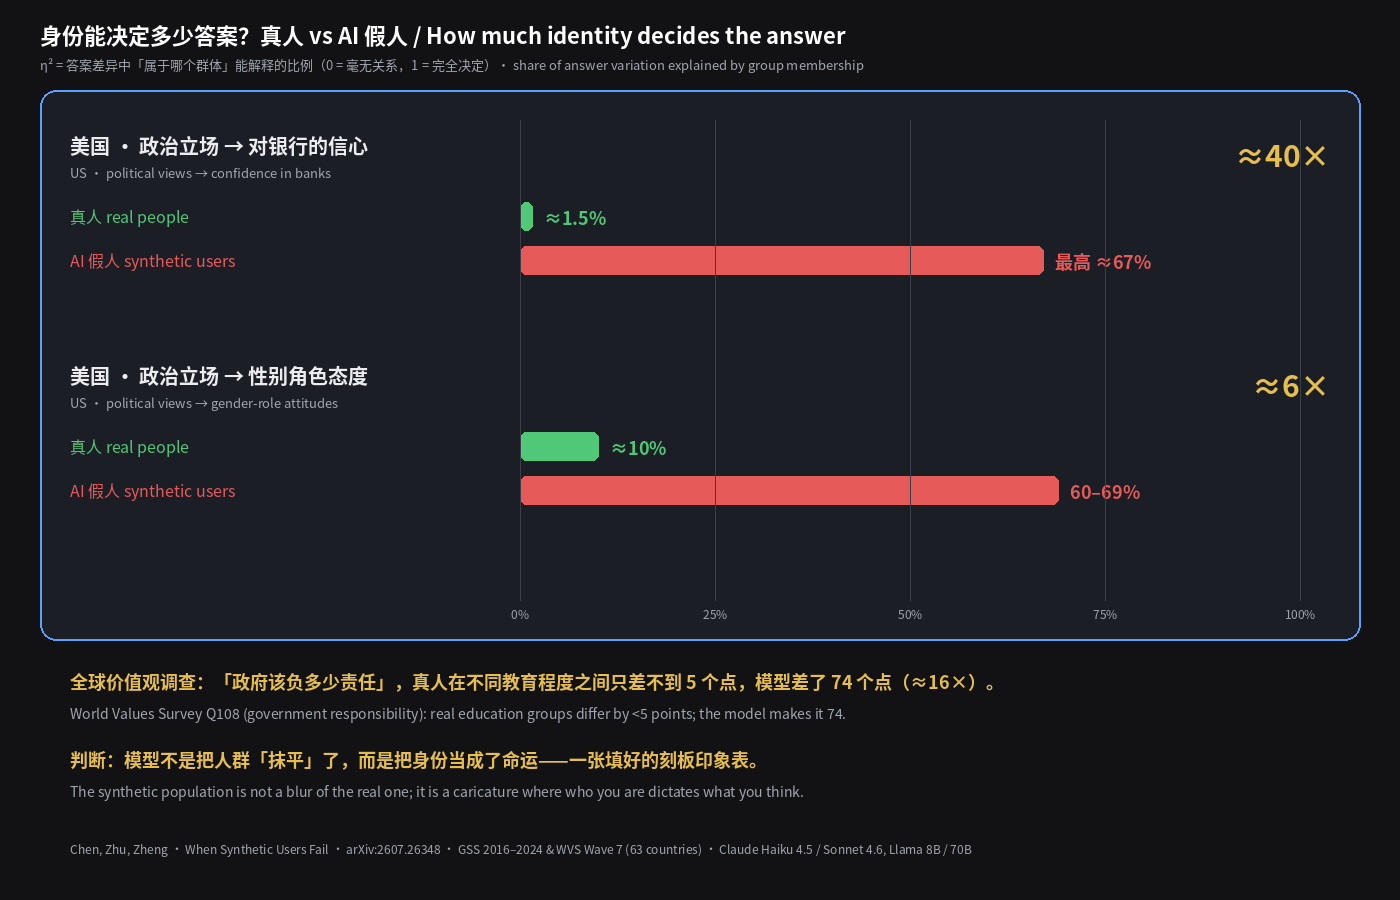
- 美国人对银行有多少信心,政治立场在真人里只能解释约 1.5% 的差异;在模型里,最高能解释约 67%——大约 40 倍。
- 性别角色态度,政治立场在真人里解释约 10%,模型里是 60–69%。
- WVS 里「政府该负多少责任」,真人在不同教育程度之间只差不到 5 个点,模型差了 74 个点。
它模拟出来的不是一个模糊版的真实人群,而是一张漫画:你是谁,就决定了你怎么想,而且比现实里紧得多。
真正的代价落在「选哪群人」上
作者把这个偏差一路推到最常见的业务决策——找出最极端、最值得投放的那个细分人群:
- 模型给出的人群间差距,是真实差距的 2–4 倍(Sonnet 4.6:GSS 2.3×,WVS 2.5×)。
- 以 Sonnet 为例,它指向的「目标人群」和真实答案不一致的比例:GSS 50%,WVS 72%。
- 最伤的是凭空造分群:真人之间差不到 10 个点、模型却差出 25 个点以上的情况,WVS 上 Sonnet 占 28%,Haiku 和 Llama 70B 最高到 41%。按它的结论去做「这个观点在 X 人群里严重分化」,你是在对一个不存在的分化下预算。
这类错误还不会互相抵消。随机噪声做多了会平均掉,刻板印象永远往同一个方向偏:让你过度细分人群、过度押注被它漫画化的那一群。
换个更强的模型?更刻板
直觉上,模型越强应该越像真人。实测不是:GSS 上 Sonnet 4.6 的中位刻板指数是 +0.104,比 Haiku 4.5 的 +0.059 还高;WVS 上刻板程度最高的是 Llama 70B(+0.136)。更强的模型更会讲「这类人会怎么想」的故事,而故事恰恰是问题所在。
还有个很尴尬的细节:只是把选项倒过来排,Sonnet 和 Haiku 就有 9.8–10.8% 的回答变了,是两次随机采样之间差异的 4–10 倍。你的调研结论,可能取决于选项是从「非常同意」排起还是从「非常不同意」排起。
所以争议点在这:合成用户卖的是「便宜的真人」,实际交付的是「一张更贵、更自信、还会夸大差异的人口学查表」。平均数像,不代表它懂人;它越懂「典型」,越不懂「具体」。
边界也说清楚:论文只测了「给人设、填问卷」这种最常见的用法,测的是说出来的态度而不是实际行为;微调过的模型、更丰富的人设构造、少样本示例可能会改变数字,用到的也不是最新一代模型。但今天市面上大多数「AI 用户调研」,正是这种用法。
下次用 AI 假用户之前,先做一张查表
拿你手上任何一份真实的历史问卷或用户数据,切成两半:一半做一张「这类人最常选什么」的查表,另一半让 AI 假用户来答。然后只看两个数:AI 有没有打赢那张查表;在你准备拿来做决定的那个人群切分上,AI 给出的差距是真实差距的几倍。顺手把选项顺序倒过来再跑一遍,看有多少答案会变。
打不赢查表,就直接用查表——它免费,而且不会编故事。AI 假用户留给它擅长的事:试问卷措辞、找题目里的歧义,而不是替你决定该打哪一群人。
判断很简单:AI 假用户最擅长的不是像人,是像刻板印象——总体看着对,你真正要下注的分群偏偏是错的。
The thousand "users" you asked an AI to role-play are not great at answering surveys. They are great at stereotypes.
The synthetic-user pitch is easy to buy: give a model a persona — age, sex, education, city, politics — let it fill in the survey for a real person, and get results in minutes for a few dollars of API spend. Research that took months now takes an afternoon. Product teams use it to rank features; marketers use it to find the segment most likely to bite.
The problem is how it gets accepted. Almost everyone checks one thing: plot the overall answer distribution and see if it looks human. If it does, it gets trusted. But the decision you actually make with it is never "what do users think on average". It is "which group cares most". That is exactly the level where it is wrong — and wrong in a consistent direction.
The average looks right, which is the trap
Chen, Zhu and Zheng, When Synthetic Users Fail (arXiv:2607.26348) test against two real surveys: the US General Social Survey (GSS, 2016–2024, 10 attitude questions, about 14.7k respondents) and World Values Survey Wave 7 (63 countries, 16 value questions, about 92k respondents). The models are Claude Haiku 4.5, Claude Sonnet 4.6, Llama 3.1 8B and Llama 3.3 70B, all under one prompt protocol and one scoring setup.
First, what it gets right: when the model is asked for a probability distribution over answers, the Jensen–Shannon divergence from real GSS answers is only 0.011–0.023 — nearly identical. That chart is the one that sells synthetic users.
But the paper does something most studies skip: it uses the dumbest possible control — a lookup table that, for the same demographics, returns what people like that most often answered in real data. Results:
- At the individual level, the models do not beat the lookup table. On GSS the best model only ties it (−0.001, CI spans zero) and Llama 8B trails by 9 points; on WVS every model is 11–22 points below it. Partial credit for near-misses and proper probability scoring do not change the verdict.
- In one line: ask a model to play a specific person and it adds nothing beyond "what people like this usually say" — and on values questions it does worse.
It does not flatten groups; it treats identity as destiny
The common worry is that AI "flattens" minorities. The paper measures the opposite: models systematically exaggerate how much identity determines opinion.
- For Americans' confidence in banks, political views explain about 1.5% of real variation; in the models, up to about 67% — roughly 40×.
- For gender-role attitudes, political views explain about 10% among real people and 60–69% in the models.
- On the WVS question about government responsibility, real education groups differ by under 5 points; the model makes it 74.
The simulated population is not a blurry copy of the real one. It is a caricature: who you are dictates what you think, far more tightly than in reality.
The real cost lands on "which segment"
The authors carry this distortion to the most common business decision — finding the most extreme segment to target:
- Model gaps between segments are 2–4× the real gaps (Sonnet 4.6: 2.3× on GSS, 2.5× on WVS).
- For Sonnet, the segment it points you to differs from the real one in 50% of GSS cases and 72% of WVS cases.
- The worst part is invented segments: real groups differ by under 10 points while the model shows 25 or more in 28% of WVS cases for Sonnet and up to 41% for Haiku and Llama 70B. Act on "this attitude is sharply split across segment X" and you are budgeting against a split that does not exist.
These errors also do not cancel out. Random noise averages away over many decisions; stereotypes always lean the same way — toward over-segmenting the population and over-betting on the group the model caricatured.
Use a stronger model? It stereotypes more
Intuition says stronger models should look more human. They do not: on GSS, Sonnet 4.6's median stereotyping index is +0.104, higher than Haiku 4.5's +0.059; on WVS the most stereotyped is Llama 70B (+0.136). A stronger model tells a better story about "what people like this think", and the story is the problem.
One more awkward detail: merely reversing the order of the answer options changes 9.8–10.8% of Sonnet's and Haiku's answers, 4–10× the difference between two random samples. Your research conclusion may depend on whether the scale starts at "strongly agree" or "strongly disagree".
So here is the argument worth having: synthetic users are sold as "cheap people", and what gets delivered is a more expensive, more confident demographic lookup table that also exaggerates differences. Looking right on average does not mean it understands people; the better it knows the "typical", the worse it knows the specific.
Boundaries: the paper tests only the most common setup — persona prompting to fill in surveys — and measures stated attitudes, not behavior. Fine-tuned models, richer persona construction or few-shot examples might move the numbers, and these are not the newest models. But most "AI user research" on the market today is exactly this setup.
Before your next synthetic-user study, build a lookup table
Take any real survey or user data you already have and split it in half. Use one half to build a "what do people like this usually pick" table; have the synthetic users answer for the other half. Then look at two numbers only: does the AI beat the table, and on the exact segment split you plan to decide on, how many times larger is the AI's gap than the real one. While you are at it, reverse the option order and rerun to see how many answers change.
If it cannot beat the table, use the table — it is free and it does not tell stories. Keep synthetic users for what they are good at: drafting and pre-testing question wording, catching ambiguous items. Not for deciding which group to bet on.
The judgment is simple: synthetic users are not good at being people; they are good at being stereotypes — right in aggregate, wrong on exactly the segment you are about to bet on.